PERMOS
Mountain Permafrost
Qu-est-ce-que le pergélisol?
Le pergélisol aussi nommé permafrost est un phénomène thermique, largement répandu dans le sol des régions froides aux pôles et en haute montagne. Le pergélisol est défini comme tout matériau du sol restant à une température égale ou inférieure à 0 °C tout au long de l'année.
Le pergélisol peut survenir dans tous les types de matériaux du sol (roche, sédiments ou sol) et contenir des quantités variables de glace (0-100%) et de matière organique (0-100%). Dans les Alpes suisses, le pergélisol est caché dans les éboulis, moraines et autres parois rocheuses au-dessus de la limite de la forêt. Dans les sédiments meubles des éboulis et glaciers rocheux, des lentilles de glace pouvant atteindre plusieurs mètres d'épaisseur peuvent exister. Dans les parois rocheuses, la présence de glace se limite aux interstices et aux fissures de la roche. En montagne, la quantité de matière organique contenue dans le pergélisol est très faible, si tant est qu’il y en ait, car celui-ci se trouve généralement au-dessus de la limite de la forêt, là où aucune végétation ne pousse.
L'existence du pergélisol dépend de la température à la surface du sol, qui est elle-même déterminée par les conditions climatiques locales (ou autrement dit le bilan énergétique de à la surface). La partie supérieure du sol dégèle chaque été et regèle en hiver. Cette couche est appelée couche active (active layer en anglais) et c’est au-dessous de sa limite inférieure – le toit du pergélisol – que commence vraiment le corps du pergélisol qui descend en profondeur jusqu’à la base du pergélisol. Dans les Alpes suisses, l'épaisseur du pergélisol varie entre quelques dizaines de mètres à basse altitude à la limite inférieure du pergélisol et plusieurs centaines de mètres sous les sommets des montagnes les plus élevées. Dans les régions polaires les plus froides, la profondeur du pergélisol peut atteindre jusqu'à 1,7 km.
The most important factor controlling the occurrence and evolution of permafrost is the ground surface temperature (GST). The GST results from the energy balance at the ground surface, which mainly depends on the air temperature and solar radiation during the snow-free season as well as the amount and duration of the winter snow cover. The GST controls the amount of energy transferred into the ground and thus the temperature of the permafrost. For permafrost studies, typically the mean annual ground surface temperature (MAGST) is calculated. In complex mountain topography, MAGST can vary considerably over short distances leading to a high spatial variability of the permafrost distribution. For example, the difference in MAGST between steep south and north faces at the same elevation can be as high as 8 °C. Fine scale variations can be a few degrees Celsius over a few metres in homogeneous terrain.
Permafrost is overlain by a layer that thaws each summer and freezes again in winter – the active layer. The thickness of this layer, the active layer thickness (ALT) typically reaches 15–100 centimeters in continuous polar permafrost and several meters in warmer mountain permafrost. The ALT varies from year to year and reflects the short-term climate fluctuations such as winter snow conditions, intensity of the summer warming and winter cooling. Inter-annual variations are smaller for ice-rich permafrost than for bedrock slopes with low ground ice content.
Temperature fluctuations in the ground are greatest close to the surface and become smaller and temporally delayed with increasing depth. For example, temperature variations arrive with a delay of around half a year at about 10 m depth and only seasonal variations over several months can be seen. From a given depth, also seasonal fluctuations are no longer observed and temperature changes reflect long-term climatic changes. This is the so-called depth of zero annual amplitude (ZAA). Here, intra-annual temperature variations are smaller than 0.1 °C. In the Swiss Alps, the ZAA is typically around 15–20 m depth.
Permafrost is relevant! It is a good climate indicator and below 0°C temperatures as well as ice containted in the ground change its geotechnical properties. Find out more:
In the Swiss Alps, the permafrost conditions and their changes are not only relevant as a climate indicator but also for mountain ecosystems as well as for the management of mountain areas in terms of natural hazards, infrastructure and land use in general. Warming or melting of the permafrost ice in the ground or in fissures of rock faces can decrease the stability of steep mountain slopes, eventually resulting in an increase in rock fall and debris flow activities.

Debris flow initiated at the front of the Ritigraben rock glacier (top, SLF Camera) that landed on the cantonal road down in the Mattervalley (bottom).
In the Swiss Alps, infrastructures at higher elevation such as mountain huts, avalanche protection structures, or cable cars are often built on permafrost. Construction in permafrost regions has to consider the special characteristics of permanently frozen ground. Increasing active layer thickness, permafrost warming or increasing slope deformation can further cause stress on the structures resulting in increased maintenance costs or a shorter service life.
In polar regions, permafrost relevance and the impacts of its warming are somewhat different. Here, people are living on the permafrost and have been using it for generations to store food. Due to the ongoing permafrost warming and thaw, buildings, roads, pipelines built on permafrost may deform and become instable. Unlike in mid-latitude mountain regions, vegetation grows in the Arctic tundra regions above the permafrost. Permafrost thaw in these large permafrost regions enables carbon and methane previously stored within the permafrost to be released into the atmosphere. Both components are important greenhouse gases with the potential to increase the ongoing climate warming.
The webvideo by SRF Kultur below illustrates and summarizes what mountain permafrost is, where it can be found and why it is important to us:
In the Swiss Alps, all observations from PERMOS show a consistent trend of continued permafrost warming and degradation in the past two decades. Permafrost temperatures below the depth of the ZAA have significantly increased, active layer thicknesses have deepened and geophysical measurements indicate an overall decrease of the ground ice content.
If you are interested to read and browse more on permafrost in mountain areas – as well as on permafrost in polar areas – we compiled a number of links and publications.
- «Snow, glacier and permafrost explained»: informative Cryo-Portal by the Swiss Academy of Sciences (in de, fr, it).
- «Permafrost – eine Einführung»: on the website of the Alfred Wegener Institute in Potsdam (in de), with a focus on permafrost in polar areas.
- International Permafrost Association: the primary organisation related to permafrost research provides a lot of information and resources.
- Frozen Ground and Permafrost: Overview and introduction by the National Snow and Ice Data Center.
- Permafrost Glossary by the United States Permafrost Association (USPA)
- Frozen-Ground Cartoons: the easy way of learning about permafrost and permafrost research. And: it thaws !!
- Haeberli, W., Noetzli, J., and Vonder Muehll, D. 2023. Using borehole temperatures in knowledge transfer about mountain permafrost: The example of the 35-year time series at Murtèl-Corvatsch (Swiss Alps). Journal of Alpine Research/Revue de géographie alpine, 111-2.
- Noetzli, J. 2020. Permafrost in den Alpen – Langzeitbeobachtung und Entwicklung über zwei Jahrzehnte. In: Lozán, J. L., Breckle, S.-W., Escher-Vetter, H., Grassl, H., Kasang, D., Paul, F. und Schickdorff, U. (Hrsg.). Warnsignal Klima: Hochgebirge im Wandel, 166–173, Hamburg, Wissenschaftliche Auswertungen, doi.org/10.2312/warnsignal-klima.hochgebirge-im-wandel.03.
- Pellet, C., and Noetzli, J. 2020. Réchauffement du pergélisol en Suisse: 20 ans de mesures. GEOAgenda, 3, 10–14.
- Noetzli, J. and Phillips, M. 2019. Mountain permafrost hydrology. Hydro-CH2018 Project. Commissioned by the Federal Office for the Environment (FOEN), Bern, Switzerland, 18 pp, doi.org/10.16904/slf.1.
- Vonder Muehll, D., Noetzli, J., and Roer, I. 2008. PERMOS – a comprehensive monitoring network of mountain permafrost in the Swiss Alps. Proceedings of the 9th International Conference on Permafrost, Fairbanks, US, 1869–1874.
WHERE IS PERMAFROST LOCATED?
Permafrost is found in polar and high-mountain environments. It iunderlies approximately 20% of the land area of the northern hemisphere and about 3–5% of the area of Switzerland.
Permafrost is found in all polar and high mountain regions of the world and is most abundant on the Northern Hemisphere in the Arctic and High Arctic of Canada and Russia. In the coldest regions, continuous permafrost is found (i.e. 90 to 100% of the area is affected), whereas in warmer or mountain regions the permafrost occurrence is discontinuous (50–90%) or sporadic (0–50%).
In Switzerland, permafrost is mostly sporadic or discontinuous and is estimated to underly 3–5% of the country. The majority of permafrost is located above 2600 m asl. with temperatures between –3 and 0 °C. As a thermal subsurface phenomenon, permafrost is mostly invisible in the landscape.
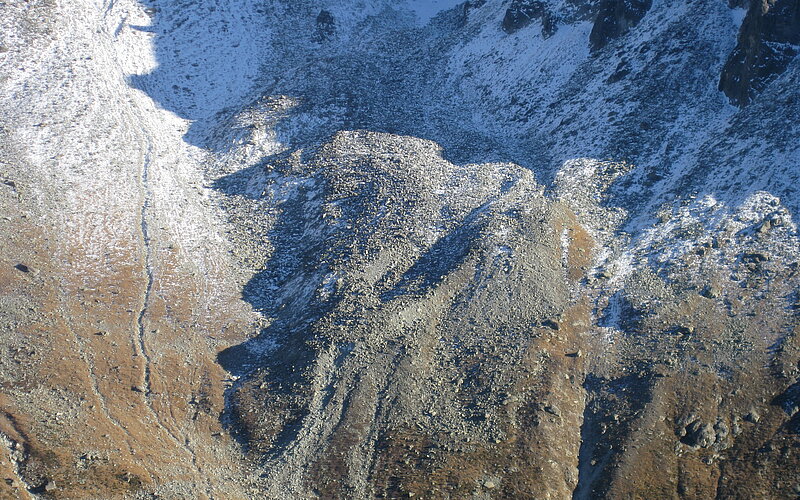
Several typical environments and landforms, however, can help to detect the presence of permafrost. Most commonly, permafrost is found in talus or debris slopes, moraines, rock walls and fractured bedrock environments. The most prominent indicator of mountain permafrost is a rock glacier. Rock glaciers are geomorphological landforms composed of a mixture of ice, debris and rocks, which move downslope under the effect of permafrost creep and build strinking tongue-shaped landforms. Rock glaciers are not actually glaciers.

Permafrost distribution can be estimated based on modelling studies. It is important to note that permafrost maps show the potential distribution of the subsurface phenomenon and provide a probability, index or alike about its occurrence at a location. However, in-situ measurements are needed for a definitive assessment of permafrost in the subsurface. We provide you with the links to two frequently used maps of the potential permafrost distribution in Switzerland.
The map by the Federal Office for the Environment (FOEN) from the year 2005 is based on the rules of thumb for permafrost distribution in Switzerland developed in the 1970ies. Details about the map can be found on the website of the FOEN. The direct link to browse the map is:
Potential permafrost distribution (BAFU)
The SLF map produced in 2019 distinguishes between bedrock permafrost and ice-rich permafrost in loose sediments below. A description of the map is provided on the website of the SLF or in the corresponding scientific publication. It can also be browsed in 3D on maps.wsl.ch. The direct link to browse the map is:
PERMOS MONITORING STRATEGY
As permafrost is not visible and is hidden below the ground surface, observations rely on field measurements.
Permafrost responds to changes in climate with a high degree of sensitivity. It is therefore considered an Essential Climate Variable (ECVs) by the Global Climate Observing System (GCOS). ECVs are a defined set of variables required for the observation of the Earth’s climate change.
The assessment of the long-term changes of permafrost requires reliable and comparable data measured at representative sites over decades. Such data also provide a basis for research, decision makers and society to improve the understanding of permafrost processes, to assess impacts of changing permafrost on infrastructure, natural hazards and ecosystems, or to validate and calibrate models.
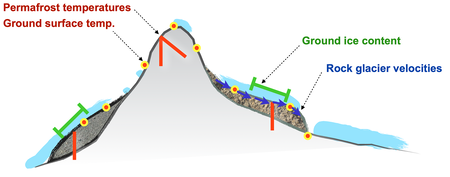
As permafrost is a thermal subsurface phenomenon, it’s observation primarily relies on field data. The PERMOS monitoring setup includes a set of variables that complement each other for a comprehensive picture of state and changes of mountain permafrost in the Swiss Alps. We measure ground temperatures at the surface and at depth in boreholes, meteorological variables, changes in ground ice content and rock glacier creep velocities.
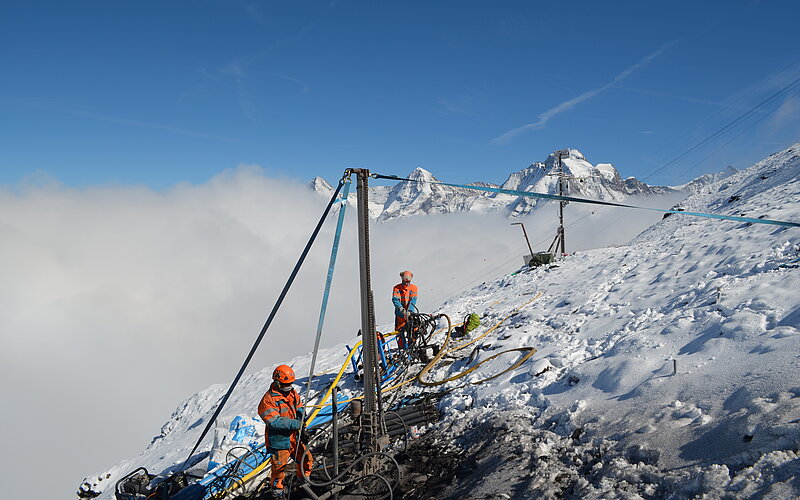
The measurement of ground temperatures in boreholes – called permafrost temperatures – is the basis of permafrost monitoring because it is the only direct observation method. Permafrost temperatures are measured at 15 sites in 30 boreholes of 20 to 100 m depth. A logger continuously records temperatures at multiple depths with a temperature sensor string installed in the borehole. Ground temperatures measured at multiple depths also allow to determine the annual active layer thickness (ALT) by linear interpolation between neighbouring temperature sensors. We compiled our best practices for borehole temperature measurements in mountain permafrost in a methods paper in 2021.
Spatially distributed ground surface temperature (GST) measurements complement the point information obtained from the boreholes. We installed 10–20 loggers at 22 of our sites. GST measurements allow to capture the influence of topography and surface cover.

Photo: Christophe Lambiel.
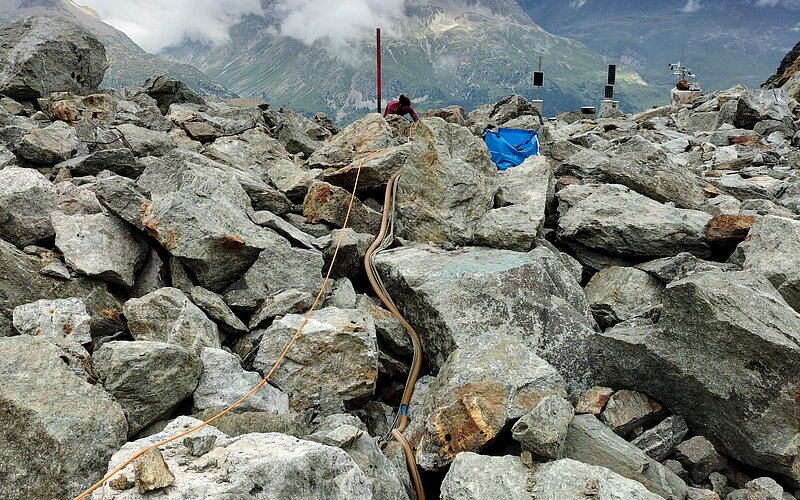
Electrical Resistivity Tomography (ERT) measurements allow the detection of changes in liquid water and ground ice content within the permafrost body. This complementary information is particularly important for ice-bearing permafrost because temperature changes are significantly reduced by latent heat uptake during ground ice melt. ERT measurements are performed annually along five fixed installed profiles close to boreholes.

Photo: Christophe Lambiel.
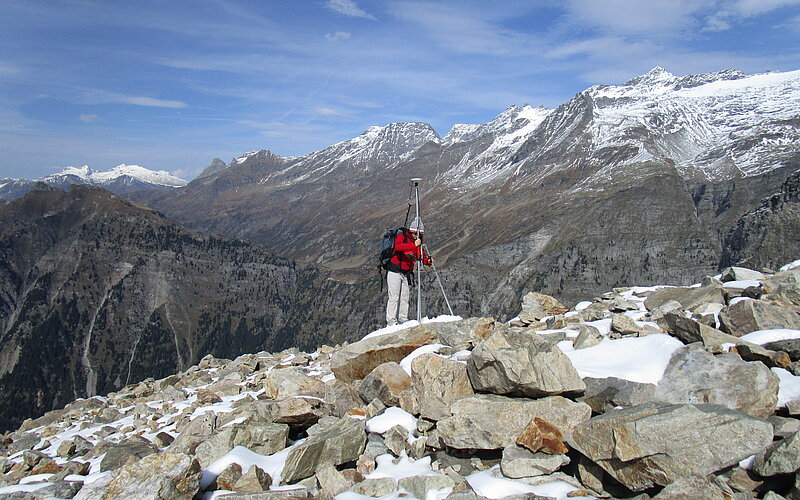
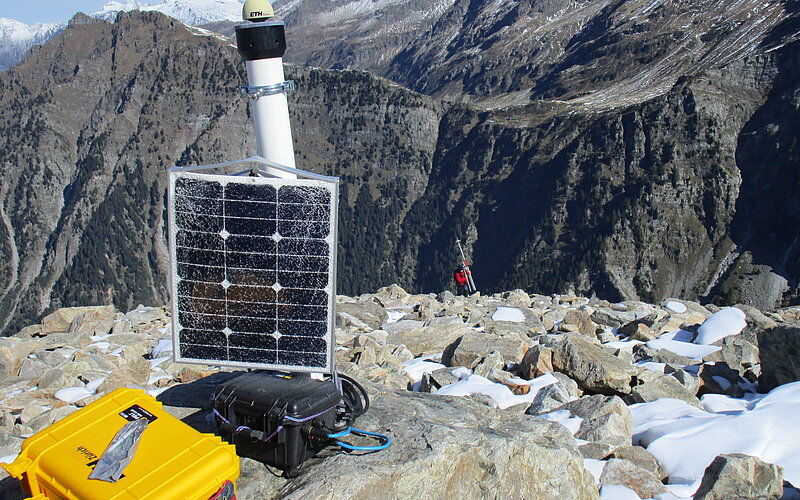
Changes in the downslope movement of permafrost landforms such as rock glaciers are important in view of slope stability and sediment transfer. They also provide indirect information on the thermal state of permafrost within the landform. Rock glacier velocity (RGV) was included in 2021 as a product of the ECV permafrost. RGV monitoring is performed on 18 rock glaciers by annual terrestrial geodetic surveys (TGS), which are complemented by continuous GNSS recordings at 8 sites to capture the intra-annual variations.

Photo: Cristian Scapozza.
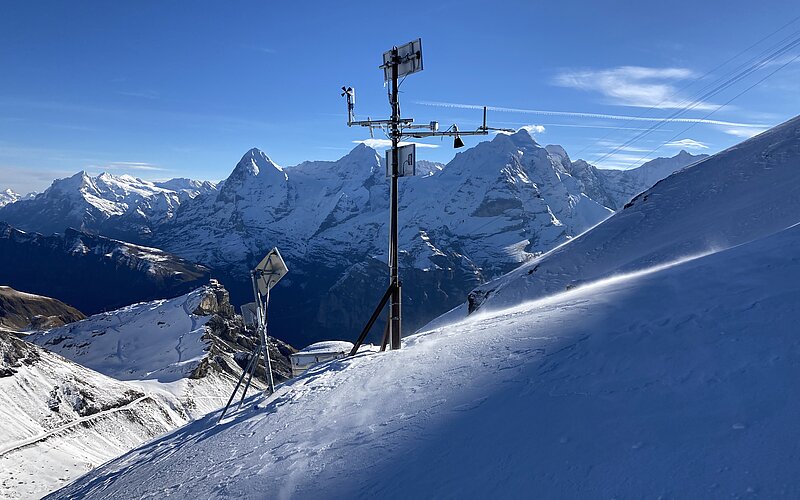
Meteorological data measured directly at the borehole sites are crucial to interpret the permafrost evolution, which is mainly driven by changes in the surface energy balance. The complex topography introduces high uncertainties when extrapolating data from operational weather stations. Automatic weather stations (AWS) including full radiation balance measurements at 6 borehole sites are part of the network.

Photo: Andi Hasler.
Rock fall events originating from permafrost slopes are documented based on observations received from various sources (e.g., mountain guides, climbers, hazard managers or seismic signals detected by the Swiss Seismological Service).
To collect as many data as possible, you can help! Please report your observations via the questionnaire of the SLF or the MountaiNow App!

Photo: Robert Kenner.
The monitoring strategy of PERMOS is continuously adapted, based on new findings from research. We also work on the documentation of our approach and collaborate with global permafrost monitoring strategies and recommendations. Some information is linked below:
- Measurement of Permafrost: New chapter in WMO #8 «Guide to Instruments and Methods of Observation»
The 2024 edition of WMO #8 now includes a chapter on permafrost measurement guidlines: WMO 2024. Guide to meteorological instruments and methods of observation, Geneva: World Meteorological Organization, doi.org/10.59327/WMO/CIMO/2. - PERMOS guidelines for temperature measurements in mountain permafrost:
Noetzli, J., Arenson, L.U., Bast, A., Beutel, J., Delaloye, R., Farinotti, D., Gruber, S., Gubler, H., Haeberli, W., Hasler, A., Hauck, C., Hiller, M., Hoelzle, M., Lambiel, C., Pellet, C., Springman, S.M., Vonder Muehll, D., and Phillips, M. 2021. Best Practice for Measuring Permafrost Temperature in Boreholes Based on the Experience in the Swiss Alps. Frontiers in Earth Science 9, 607875, doi.org/10.3389/feart.2021.607875. - GTN-P Strategy and Implementation Plan (2021–2024)
The 4-year road map for the global network regarding organisation and implementation. - GTN-P Measurement Recommendations and Guidelines
Basic practices of field measurements for temperature measurements in boreholes and active layer thickness. - Rock Glacier Velocity as an associated parameter of ECV Permafrost
Baseline concepts by the IPA Action Group Rock glacier inventories and kinematics
PHOTO GALLERY
Browse through a collection of photos illustrating permafrost in mountain regions and the measurements performed in the framework of the PERMOS Network.
The pictures in the gallery can be downloaded and used according to the CC BY NC SA 4.0 license. For all other use of the photos, the PERMOS Office or the photographer have to be contacted. The name of the photographer and a description of the photos can be found in the gallery.

